Ever crafted a report or analytics masterpiece, only to see it fade into obscurity after just a few months? You’re not alone. In my experience, less than 20% of data and analytics outputs are effectively utilised, and even fewer deliver measurable business value. So, how can we, as data and analytics professionals, ensure that the insights we provide truly matter? To unlock the full value of your data and analytics initiatives, they must be Enterprise Grade—not mere tactical items but foundational components of business success seamlessly integrated into your organisation, consistently yielding valuable insights that drive measurable business impacts.
This article delves into the key principles and practices necessary to ensure your reporting and analytics reach Enterprise Grade status.
5 Key Principles
1. Risk Managed
If you’re working with data, you’re working with risk. From data breaches to reputational damage or erroneous decisions based on flawed data, risks lurk everywhere. Yet, many overlook these lurking dangers, dangers that threaten their data integrity and security. In today’s digital landscape, managing risk is essential and requires a proactive and comprehensive approach. Utilising open endpoints for example, or not knowing who has access to your analytics is a surefire way to invite trouble. It’s crucial to know exactly who interacts with your data and why.
So, how do you navigate this perilous terrain effectively? Provide visibility and keep leadership informed about security, privacy, and other data-related risks associated with your initiatives. Form alliances with key teams within your organisation – including data governance, IT security, risk management, and compliance teams. Too often, these teams are viewed as obstacles rather than allies. They are kept at arm’s length, fearing they might stifle innovation or lead to reduced speed of delivery. Instead, embrace their collaboration, seek their advice, value their expertise, and most importantly, engage them early and proactively to collaborate on robust solutions for safeguarding your data assets.
A ‘risk realised’ reverberates throughout the entire organisation, jeopardising the very outcomes you strive to achieve through your data and analytics initiatives. Managing risk is an ongoing journey – stay vigilant, stay informed. Know the risks your data and analytics invites, and manage them proactively.
2. Supportable
Understanding your customers’ unique needs, expectations and capabilities is imperative in ensuring that any data and analytics solutions you create are supportable, and fit-for-purpose- including meeting any longevity requirements. If what you create is not easily supportable – either it requires skills that the data and analytics product owners team do not have, or the process of updating the report is cumbersome and complex, it is highly likely your solution will fall into obscurity pretty quickly.
The concept of “supportable” is often overshadowed by the allure of cutting-edge technology and vendor defined ‘best practices’. Instead of aiming for the latest technology trends, start with the basics. Focus on one outcome at a time, integrating seamlessly with existing processes and tools where possible will reduce friction. Often, the simplest solution – like a couple of monthly reports showcasing essential metrics – will deliver significant value with minimal complexity and cost – and this approach is far more likely to lead to usage and thus outcomes.
When introducing any new tools or processes, what may seem logical to you could be perplexing to others. Be active in change management and foster a culture of consistent collaboration and feedback where questions and challenges are encouraged. If questions from the end users are scarce, it may signal the need to check the usage stats. Embrace curiosity and engagement from users – it’s a sign of genuine interest and a solid pathway to better.
3. Transparent
When it comes to transparency, the first thing that comes to mind is data visualisations. Visualisations are incredibly powerful tools for conveying complex information quickly, but they’re often misused. Using the wrong visualisation leads to confusion rather than clarity. Overcomplicating visuals with fancy elements and complex metrics adds more noise than value, making it harder for users to grasp the message you’re trying to convey. To distinguish between noise and necessity, be clear about your desired outcomes, and the impact on business processes and decisions. Let’s look into a case study to illustrate this point.
During the early days of the COVID-19 pandemic, a university was forced to shift their open day to an online format. The prospect of an online iteration of campus open days presented exciting opportunities from a data perspective. The digital platform offered enhanced capabilities for tracking prospective student journeys compared to its physical counterpart.
Needless to say, the team was inundated with data thanks to the digital change. They could have easily drowned the stakeholders in a sea of reports and charts. Instead, they chose to focus on leveraging insights to drive meaningful actions. Only displaying what was necessary. In the end, it was distilled down to just eight critical questions – each selected through stakeholder consultation and tied to a tangible business outcome. The rationale behind these questions was clear – they represented actionable insights with direct relevance to strategic business objectives.
For instance, were there any sessions with lower engagement? This feedback could inform presenter training for future events. Did we observe any gender ratio issues in attendee data? This could prompt a re-evaluation of our marketing strategies.
The key takeaway – less is more. Resist the temptation to bombard users with trivial details and hundreds of unnecessary or ineffective visualisations. Transparency in data visualisation is more than just pretty charts – it’s about making information understandable and actionable. Strip away the noise, focus on the outcome and make the business action crystal clear.
4. Integrated
In practical terms integration is about ensuring what you have built fits seamlessly into your organisation’s landscape. No matter how impressive a data solution, tool or report might be, if it doesn’t integrate well, it simply won’t last. Let’s dive into a practical example.
A data team encountered a significant challenge when tasked with developing strategic reports using traditional SQL databases and SQL Server Reporting Services (SSRS). Driven by the notion of adhering to best practices, they opted for a more advanced approach, leveraging Online Analytical Processing (OLAP) cubes and Multidimensional Expressions (MDX) delivered through a custom web interface. The allure of multi-dimensionality and enhanced analytics capabilities offered by OLAP/MDX seemed exciting and relevant for our complex and multi-dimensional data requirements. However, what initially appeared as a logical, progressive step soon revealed its inherent complexities.
As they delved into mastering MDX, and building the OLAP cube, they encountered a series of challenges. Yes, the end result was indeed impressive – the user interface was clean, the data displayed comprehensive and easy to interrogate, but they soon realised that accommodating stakeholder change requests for even minor modifications was cumbersome at best. Rather than having the entire team skilled in the new tools and languages, we had only two people – so every update had to fall on their already overworked and stressed shoulders. This deviation from the team’s collaborative and streamlined processes and highlighted the inherent lack of sustainability in our chosen approach.
This scenario is common in data and analytics where data teams often gravitate towards complex and expensive solutions, eager to explore new capabilities and technologies, without considering their long-term viability or alignment with existing team processes. Whether it’s investing in top-of-the-line Data Fabrics or adopting niche tools like Tableau amidst an organisation predominantly using Power BI, such decisions often result in isolated solutions that fail to integrate seamlessly into the broader technology landscape. Much like in nature, failure to integrate is failure to survive.
Prioritising the cohesion of all data solutions with existing infrastructure, languages, processes, and capabilities is essential. Instead of being drawn to flashy new tools, we need to push ourselves to seek solutions that are not only technically robust but also seamlessly integrate into the broader environment, emphasising sustainability and genuine integration.
5. Positive ROI
At its core, positive Return On Investment (ROI) simply means that the benefits derived from a data and analytics solution outweigh its costs. Whether those benefits come in the form of efficiency gains, cost reductions, or increased revenue, the bottom line remains the same – it shouldn’t cost more to maintain than it provides in financial returns.
While the concept of positive ROI may seem straightforward, it encounters scepticism, particularly in an industry where data and analytics are often perceived as enablers. The prevailing notion often suggests that these elements incur costs without directly contributing to returns since their primary function is to enable other business operations. It’s important to shift the mindset to view data and analytics as both a strategic asset and liabilities. Let me share an example.
Inspired by a Gartner conference, a former leader decided that implementing a top-of-the-line Master Data Management (MDM) system was the key to advancing our data journey. The MDM was framed as the sturdy foundation upon which the company’s operations would thrive. So, without many tangible benefits linked to the $1.2 million project, we forged ahead.
Initial enthusiasm soon turned to resistance. It was perceived by many as another shiny yet unnecessary IT tool with no clear value proposition. As the months passed, the project ballooned in cost and complexity, far exceeding its initial budget and requiring extensive unanticipated support. After a challenging 18-month endeavour, the project was classified as a failure.
Subsequently, the decision was made to replace the expensive, complex MDM system with a more cost-effective in-house built much simpler solution – costing at a mere fraction of the initial investment. Despite its lower cost, it was able to deliver on the original scope of the project, and provide tangible enterprise benefits.
This case study illustrates the multi-solution options inherent in data and analytics initiatives, emphasising the importance of subjecting each project and deliverable to meticulous ROI evaluation. Investments and costs must both be aligned with tangible business outcomes. By recognising data initiatives as dual assets and liabilities, organisations can navigate the complexities of modern data landscapes with strategic clarity and purpose.
Calculate the costs and benefits before initiating any data project, it’s imperative, and transparency is a must – project owners must be fully informed to maintain trust. As projects progress, there inevitably comes a time when management scrutinises expenditures, whether on cloud bills or resource allocations. It’s essential to be able to explain and balance these costs to maintain credibility and confidence in the project’s viability.
If you cannot achieve a positive ROI with your approach, question if what you are doing is really necessary. If the outcome is indeed necessary, then find a way to strip the solution back in its complexity and costs.
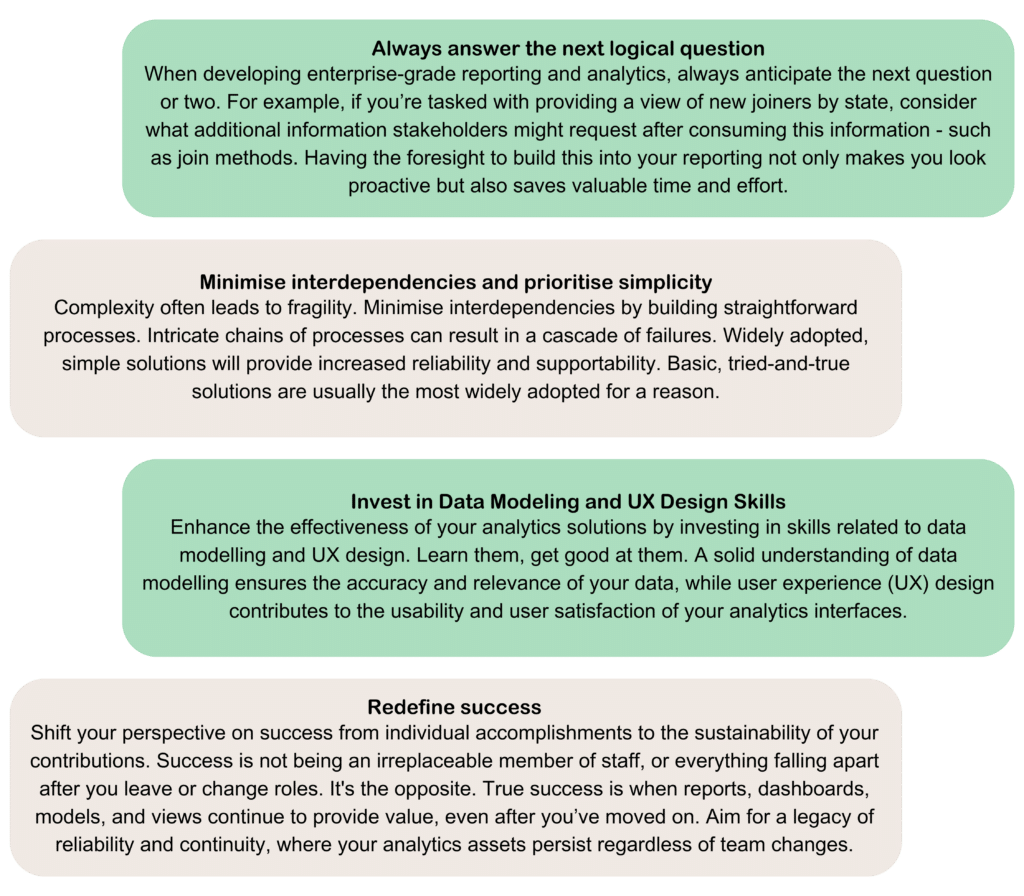
Best Practices
There are a number of best practices to follow when setting out to achieve enterprise-grade data and analytics.